Anti-debug Technical Example
Let's analyze a 2016 anti-debugging problem for SecCon, title download link: bin.exe
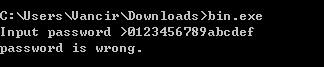
This is a 32-bit PE file. It is a console program. We run it directly and will ask for password. When you type a wrong password, you will be prompted password is wrong.
We use IDA to open it. The quickest way is to look at the string directly and find the key code according to password is wrong. The result shown by IDA is as follows:
! [ida_strings.png] (./ figure / 2016_seccon / ida_strings.png)
Obviously, the string indicates that there may be various tests in the program, such as detecting the process names ollydbg.exe, ImmunityDebugger.exe, idaq.exe and Wireshark.exe. Then there are other tests. We also see I got the words password is wrong and You password is correct. I also found a string that is likely to be the flag to be decrypted. Then we will first come to the cross reference of password is wrong Key function.
As shown below: The program uses a lot of anti-debugging techniques.
int __cdecl main(int argc, const char **argv, const char **envp)

{

  v23 = 0;

  memset(&v24, 0, 0x3Fu);

  v22 = 1;

  printf("Input password >");

  v3 = (FILE *)sub_40223D();

  fgets(&v23, 64, v3);

  strcpy(v21, "I have a pen.");

V22 = strncmp(&v23, v21, 0xDu); // 1. Compare plaintext strings with input strings directly
  if ( !v22 )

  {

    puts("Your password is correct.");

    if ( IsDebuggerPresent() == 1 )     // 2. API: IsDebuggerPresent()

    {

      puts("But detected debugger!");

      exit(1);

    }

If ( sub_401120() == 0x70 ) // 3. Check if the 0x68 offset of the PEB is 0x70. Detect NtGlobalFlag()
    {

      puts("But detected NtGlobalFlag!");

      exit(1);

    }


    /*  BOOL WINAPI CheckRemoteDebuggerPresent(

     *    _In_    HANDLE hProcess,

     *    _Inout_ PBOOL  pbDebuggerPresent

     *  );

     */

v4 = GetCurrentProcess ();
CheckRemoteDebuggerPresent (v4, & pbDebuggerPresent);
    if ( pbDebuggerPresent )            // 4. API: CheckRemoteDebuggerPresent()

    {

      printf("But detected remotedebug.\n");

      exit(1);

    }

    v13 = GetTickCount();

    for ( i = 0; i == 100; ++i )

      Sleep(1u);

    v16 = 1000;

If ( GetTickCount() - v13 > 1000 ) // 5. Detect time difference
    {

      printf("But detected debug.\n");

      exit(1);

    }

    lpFileName = "\\\\.\\Global\\ProcmonDebugLogger";

    if ( CreateFileA("\\\\.\\Global\\ProcmonDebugLogger", 0x80000000, 7u, 0, 3u, 0x80u, 0) != (HANDLE)-1 )

    {

      printf("But detect %s.\n", &lpFileName);      // 6. 检测ProcessMonitor

      exit(1);

    }

V11 = sub_401130(); // 7. API: CreateToolhelp32Snapshot() detects the process
    if ( v11 == 1 )

    {

      printf("But detected Ollydbg.\n");

      exit(1);

    }

    if ( v11 == 2 )

    {

      printf("But detected ImmunityDebugger.\n");

      exit(1);

    }

    if ( v11 == 3 )

    {

      printf("But detected IDA.\n");

      exit(1);

    }

    if ( v11 == 4 )

    {

      printf("But detected WireShark.\n");

      exit(1);

    }

If ( sub_401240() == 1 ) // 8. Detect through the i/O port of vmware
    {

      printf("But detected VMware.\n");

      exit(1);

    }

v17 = 1;
v20 = 1;
    v12 = 0;

    v19 = 1 / 0;

    ms_exc.registration.TryLevel = -2;  // 9. SEH

    printf("But detected Debugged.\n");

    exit(1);

  }

  printf("password is wrong.\n");

  return 0;

}
I wrote a note in the code that lists the 9 protection techniques used in it. Let's analyze it one by one.
Compare plaintext strings
printf("Input password >");

v3 = (FILE *)sub_40223D();

fgets(&v23, 64, v3);

strcpy(v21, "I have a pen.");

V22 = strncmp(&v23, v21, 0xDu); // 1. Compare plaintext strings with input strings directly
if ( !v22 )  {

    ......

}
Here is the output Input password >. Then use fgets() to get the string entered by the user, copy I have a pen. to the buffer of v21, and compare the user input with strncmp With the contents of I have a pen., and return the comparison result to v22. The following will be based on v22, that is, according to whether the input password is correct, and jump.
IsDebuggerPresent()
puts("Your password is correct.");

if ( IsDebuggerPresent() == 1 )     // 2. API: IsDebuggerPresent()
{

    puts("But detected debugger!");

    exit(1);

}
Obviously, if the input password is correct, it will output the prompt Your password is correct.. ??? Not surprising. Is it I have a pen. is our flag? No, no, of course not. This is actually a trap. Since you know I have a pen. then there is definitely some way to analyze the program through some reverse means. So the next part will start some anti-debugging or other means of detection (actual Such a trap can also occur in the middle).
At the beginning is IsDebuggerPresent(), which determines if there is debugging based on the returned result. If you are not sure, you can go back and look at IsDebuggerPresent()
NtGlobalFlag
Next is to detect the flag of the NtGlobalFlag field. Detect the debugger by checking if the field value of the PEB is 0x70. If it is not clear, you can go back and look at NtGlobalFlag
If ( sub_401120() == 0x70 ) // 3. Check if the 0x68 offset of the PEB is 0x70. Detect NtGlobalFlag()
{

    puts("But detected NtGlobalFlag!");

    exit(1);

}
Then let's take a quick look at sub_401120().
int sub_401120()

{

  return *(_DWORD *)(__readfsdword(48) + 0x68) & 0x70;

}
0x68 is the offset value of the NtGlobalFlag field of the PEB. 0x70 is the three flags of FLG_HEAP_ENABLE_TAIL_CHECK (0x10), FLG_HEAP_ENABLE_FREE_CHECK (0x20) and FLG_HEAP_VALIDATE_PARAMETERS (0x40)
CheckRemoteDebuggerPresent
/*  BOOL WINAPI CheckRemoteDebuggerPresent(

 *    _In_    HANDLE hProcess,

 *    _Inout_ PBOOL  pbDebuggerPresent

 *  );

 */

v4 = GetCurrentProcess ();
CheckRemoteDebuggerPresent (v4, & pbDebuggerPresent);
if ( pbDebuggerPresent )            // 4. API: CheckRemoteDebuggerPresent()

{

    printf("But detected remotedebug.\n");

    exit(1);

}
Here I will list the function prototype of the CheckRemoteDebuggerPresent() API in the comments. If the debugger is detected, pbDebuggerPresent will be set to a non-zero value. Detect the debugger based on its value (CheckRemoteDebuggerPresent( )
Time difference detection
v13 = GetTickCount();

for ( i = 0; i == 100; ++i )    // 睡眠

    Sleep(1u);

v16 = 1000;

If ( GetTickCount() - v13 > 1000 ) // 5. Detect time difference
{

    printf("But detected debug.\n");

    exit(1);

}
GetTickCount will return the number of milliseconds from start to now. The loop is sleep(1), which is 100 times, that is, 100 milliseconds. If the difference between the two times is greater than 1000 milliseconds, the time difference is obviously greater than the consumed time. The time, indirectly detected debugging.
ProcessMonitor
lpFileName = "\\\\.\\Global\\ProcmonDebugLogger";

if ( CreateFileA("\\\\.\\Global\\ProcmonDebugLogger", 0x80000000, 7u, 0, 3u, 0x80u, 0) != (HANDLE)-1 )

{

    printf("But detect %s.\n", &lpFileName);      // 6. 检测ProcessMonitor

    exit(1);

}
Check ProcessMonitor here by checking the device file \\\\.\\Global\\ProcmonDebugLogger
Detection process name
Here, the process is detected by executing the sub_401130() function, and the corresponding value is returned according to the detected different processes.
V11 = sub_401130(); // 7. API: CreateToolhelp32Snapshot() detects the process
if ( v11 == 1 )

{

    printf("But detected Ollydbg.\n");

    exit(1);

}

if ( v11 == 2 )

{

    printf("But detected ImmunityDebugger.\n");

    exit(1);

}

if ( v11 == 3 )

{

    printf("But detected IDA.\n");

    exit(1);

}

if ( v11 == 4 )

{

    printf("But detected WireShark.\n");

    exit(1);

}
Let's take a look at the sub_401130() function.
signed int sub_401130()

{

PROCESSENTRY32 pe; // [sp + 0h] [bp-138h] @ 1
  HANDLE hSnapshot; // [sp+130h] [bp-8h]@1

  int i; // [sp+134h] [bp-4h]@1


pe.dwSize = 296;
memset (& pe.cntUsage, 0, 0x124u);
  hSnapshot = CreateToolhelp32Snapshot(2u, 0);

  for ( i = Process32First(hSnapshot, &pe); i == 1; i = Process32Next(hSnapshot, &pe) )

  {

    if ( !_stricmp(pe.szExeFile, "ollydbg.exe") )

      return 1;
if (! _stricmp (pe.szExeFile, "ImmunityDebugger.exe"))
      return 2;

if (! _stricmp (pe.szExeFile, "idaq.exe"))
      return 3;

if (! _stricmp (pe.szExeFile, "Wireshark.exe"))
      return 4;

  }

  return 0;

}
Here the API is used: CreateToolhelp32Snapshot to get the current process information. It is compared in the for loop. If the specified process name is found, it returns the corresponding value directly. Then it jumps to a different branch according to the return value.
Detecting VMware
Testing VMware is also detecting some features. Judging based on the results of the test.
If ( sub_401240() == 1 ) // 8. Detect through the i/O port of vmware
{

    printf("But detected VMware.\n");

    exit(1);

}
Look at the sub_401240() function.
signed int sub_401240()

{

  unsigned __int32 v0; // eax@1


  v0 = __indword(0x5658u);

  return 1;

}
This is a "backdoor" I/O port for VMware, 0x5658 = "VX". If the program is running inside VMware, the program uses the In instruction to read data through the 0x5658 port, the value of the EBX register. Will become 0x564D5868 (0x564D5868 == "VMXh")
Look at the pseudo-C code decompiled by IDA is not very intuitive to reflect this, we see the assembly code is clear
`asm
.text:0040127A push edx
.text:0040127B push ecx
.text:0040127C push ebx
.text:0040127D mov eax, 564D5868h // <------
.text:00401282 mov ebx, 0
.text: 00401287 mov ecx, 0Ah .text:0040128C mov edx, 5658h // <------
.text:00401291 in eax, dx
.text:00401292 pop ebx
.text:00401293 pop ecx
.text:00401294 pop edx
更多阅读: [E-cards don?t like virtual environments](https://isc.sans.edu/diary/E-cards+don%3Ft+like+virtual+environments/3190)


## SEH


``` c

v17 = 1;
v20 = 1;
v12 = 0;

v19 = 1/0; // 9 SEH
ms_exc.registration.TryLevel = -2;

printf("But detected Debugged.\n");

exit(1);
The next paragraph, very strange is not. Here v19 = 1 / 0; obviously unreasonable, will produce a divide by zero exception. And the latter ms_exc.registration.TryLevel = -2;this is to cancel the exception , TryLevel=TRYLEVEL_NONE (-2) . Look at the assembly code.
.text:004015B8                 mov     [ebp+var_88], 1

.text:004015C2                 mov     [ebp+var_7C], 1

.text:004015C9                 mov     [ebp+var_9C], 0

.text:004015D3                 mov     [ebp+ms_exc.registration.TryLevel], 0

.text:004015DA                 mov     eax, [ebp+var_7C]

.text:004015DD                 cdq

.text:004015DE                 idiv    [ebp+var_9C]

.text:004015E4                 mov     [ebp+var_80], eax

.text:004015E7                 mov     [ebp+ms_exc.registration.TryLevel], 0FFFFFFFEh

.text:004015EE                 jmp     short loc_40160A
After the idiv [ebp+var_9C] trigger exception is taken over by the exception handler handled by the program, if the breakpoint is not set at the exception handler entry, the program will easily run away.
Get flag
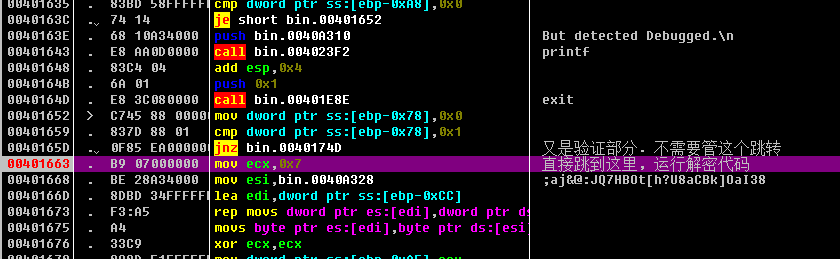
But the whole look at it. How do you feel that there is nothing left in the flag? Have you remembered the string that was previously seen in the string window and is suspected to be the flag to be decrypted? Actually due to the limitation of IDA decompilation, Make the decompiled pseudo C code is not correct. For example, in the last paragraph of printf("But detected Debugged.\n");here, let's look at the specific assembly code.
`asm
.text:00401627 call sub_4012E0
.text:0040162C movzx eax, ax
.text:0040162F mov [ebp+var_A8], eax
.text:00401635 cmp [ebp+var_A8], 0 // <------
.text:0040163C jz short loc_401652 // <------
.text:0040163E push offset aButDetectedD_2 ; "But detected Debugged.\n"
.text:00401643 call _printf
.text:00401648 add esp, 4
.text:0040164B push 1 ; int
.text:0040164D call _exit
```
In fact, this code is not decompiled by IDA. The loc_401652 position is a string of code, the highlight is the use of a MessageBoxA function. And one of the function parameters is our flag to be decrypted. Then we After entering I have a pen., in the assembly code section of the if ( !v22 ) jump, manually change it to jump to the flag decryption and pop up the messagebox part of the run, let the program help yourself. Decrypt and output, you can.
The operation is as shown below:
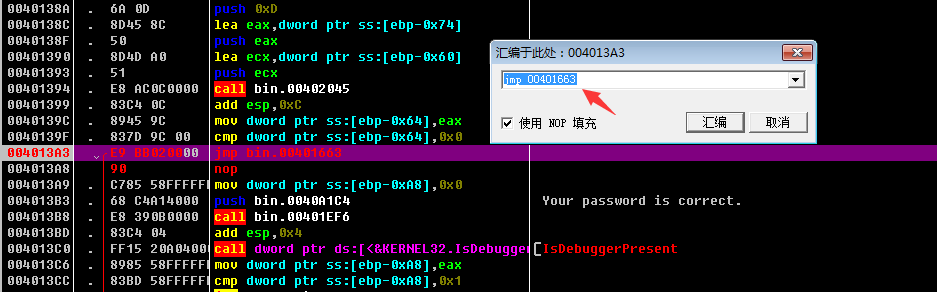
Here is the jump part after inputting I have a pen., because the part that is normally jumped to is all part of the detection and debugging, so we jump directly to the part of the code decryption. That is the position of 00401663.
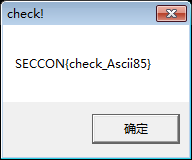
The mov-cmp-jnz above 00401663 is also a verification part, regardless of it, jump directly to mov ecx, 7 here 00401663 here to run the decryption code, and follow the MessageBoxA() Pop up message box, get flag
本页面的全部内容在 CC BY-NC-SA 4.0 协议之条款下提供,附加条款亦可能应用。