Single Step Tracking Method
The principle of the single-step tracking method is to go through the steps of (F8), step (F7) and run to (F4) of Ollydbg, completely go through the self-shelling process of the program, skip some fragments of the loop recovery code, and use the single Step to ensure that the program will not skip OEP. This way, after the software auto-hull module is finished running, it will reach OEP and dump the program.
要点
- Open the program and press F8 to step down. Try to implement the downward jmp jump.
- You will often encounter large loops, then use F4 to skip the loop.
- If the function is not far away is a call (near call), then we try not to skip directly, but enter this call
- The jmp instruction with a large jump range is most likely to jump to the original program entry point (OEP).
example
The sample program can be downloaded here: 1_trace.zip
The single-step tracking method is to go down the program entry point step by step. In the single-step process, pay attention to the EIP not to go wrong, but for some complicated shells, the single-step process will be extremely boring and easy. I confuse myself. So single-step tracking is also often used to analyze some key code parts (combined with static analysis), rather than completely from the beginning to the end, which is contrary to the concept of reverse engineering.
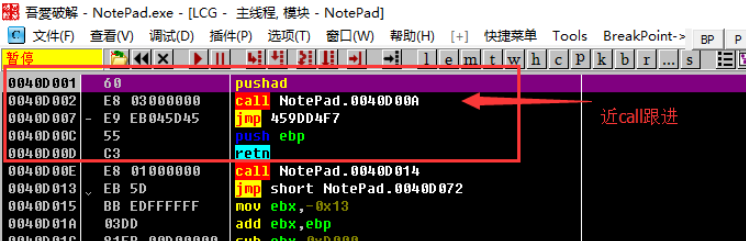
Open the Notepad.exe in the archive with Ollydbg and stop at the location below. The entry point is a pushad that saves all register states to the stack, followed by a call call to the function at 0040D00A. After that, unconditionally jump to 459DD4F7, then push ebp and retn obviously have no meaning. Like this entry point is a call we call near call, for near call us Select step, press F7 (of course you can only choose to step, or EIP will stop the program).
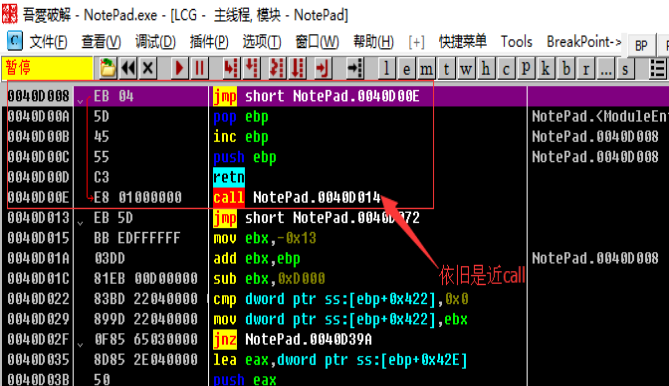
After the stepping is a call, we continue to step, press F7, follow up and find that there is no near call, we can see the program in the GetModuleHandleA, GetProcAddress and other APIs, continue to analyze downwards.
After that, we will encounter multiple jumps. We try to satisfy the downward jump. For the upward jump, we will not implement it and use F4 to jump out of the loop until 0040D3AF. We look at the following code.
`asm
0040D3AF 61 popad
0040D3B0 75 08 jnz short NotePad.0040D3BA
0040D3B2 B8 01000000 mov eax,0x1
0040D3B7 C2 0C00 direction 0xC 0040D3BA 68 CC104000 push NotePad.004010CC
0040D3BF C3 retn ```
Here popad can restore the state of the register saved at the program entry point, then jnz jumps to 0040D3BA, here uses push and retn to change EIP to 004010CC, also That is to say, after the shell decompresses the code and other resources, it will jump to push through jnz, then set EIP to the original entry point (OEP) and return by push and ret. Go to OEP, and then continue to execute the code of the original program. After we return to retn, we can see the following:
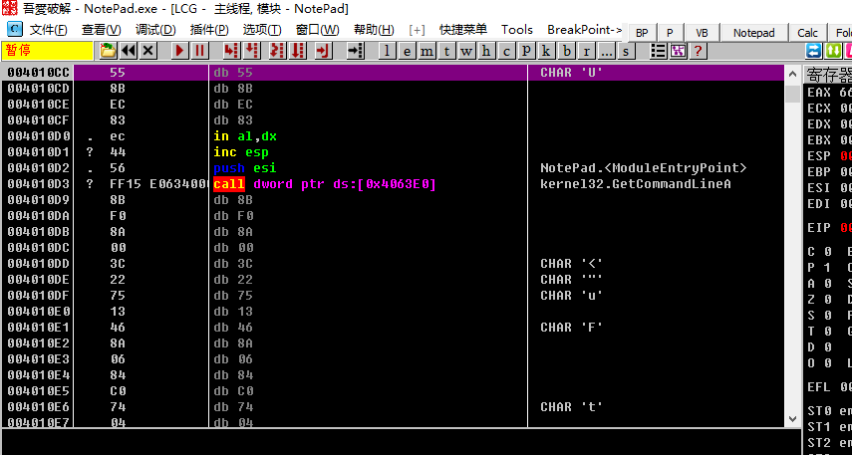
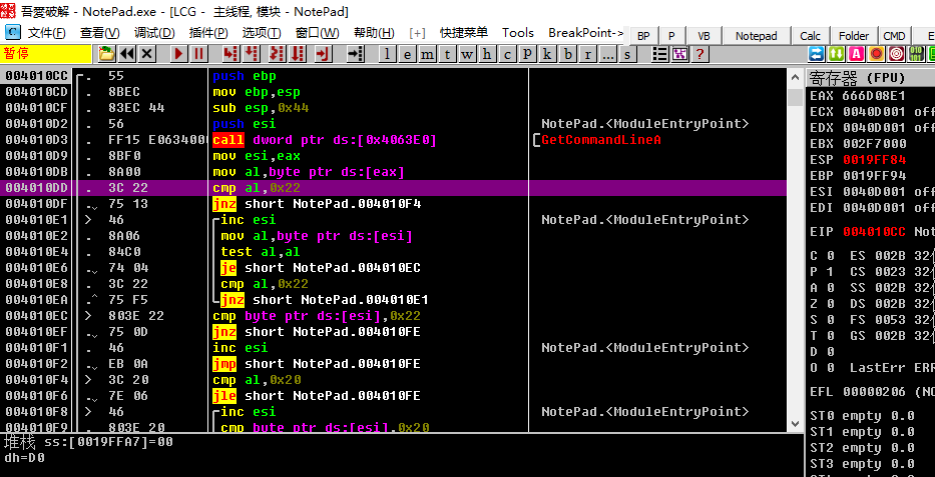
Obviously, we went to a bunch of places where Ollydbg was mistaken for data. Obviously Ollydbg analysis error, we need to let Ollydbg re-analyze, we can right-click analysis->delete analysis from module. , or pressctrl+a`, which correctly displays the assembly instructions at OEP.
本页面的全部内容在 CC BY-NC-SA 4.0 协议之条款下提供,附加条款亦可能应用。